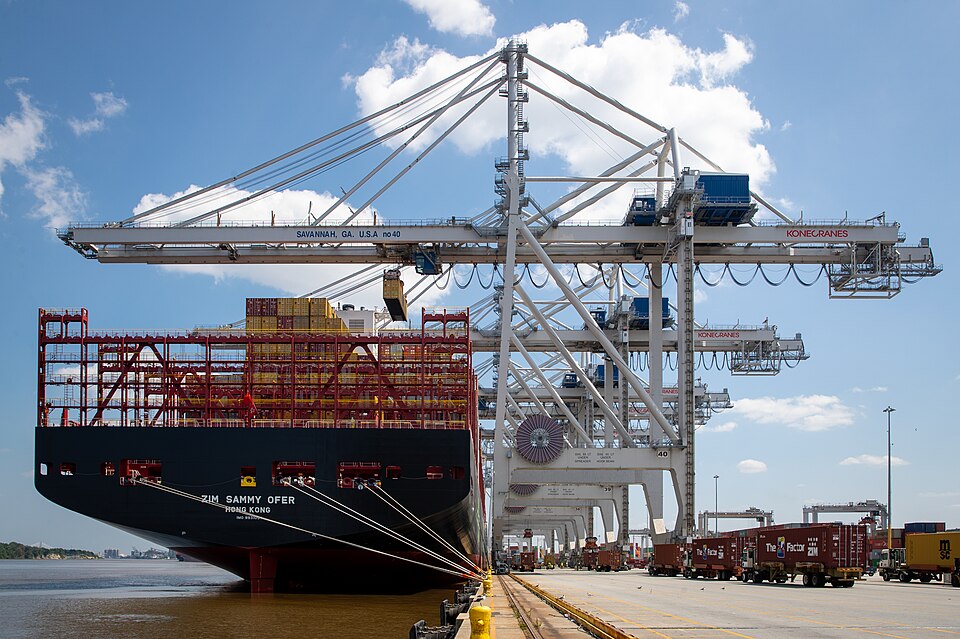
Imports jump and the goods trade gap is the widest since March 2025
The Census Bureau's advance count puts August's goods deficit at $132.6 billion, $13.7 billion more than July's, as imports rose $17.4 billion to $336.1 billion, led by industrial supplies, which include petroleum, and by capital goods, which Reuters tied to the AI buildout; trade has subtracted from growth for three straight quarters, the Atlanta Fed's model now has it taking 2.60 percentage points off third-quarter growth, and the full report, with services and the oil detail, comes on Tuesday 6 October.
What the Census counted
The Census Bureau's Monthly Advance Economic Indicators Report, released at 8:30 a.m. on Wednesday 30 September, puts the deficit in goods trade for August at $132.6 billion, up $13.7 billion from $118.9 billion in July. Exports of goods were $203.4 billion, $3.7 billion more than in July, and imports were $336.1 billion, $17.4 billion more. The deficit is the gap between the two: what the country bought from abroad less what it sold abroad. [1]
It is the widest gap since March 2025, when it reached $158.7 billion, a record by the account of Haver Analytics, which reported that August's figure was the largest since then. The bureau's own monthly series, as printed in its July report, bears that out: every month from April 2025 to July 2026 is smaller. Imports were also the highest since March 2025, when they were $340.1 billion. The deficit was $101.1 billion in June and $85.2 billion in August 2025. Economists polled by Reuters had expected $115.0 billion; the Action Economics survey cited by Haver had expected $113.9 billion. [1, 2, 4, 3]
'Advance' means early and nearly complete. The bureau builds the figures from the documents collected by U.S. Customs and Border Protection, says the current month reflects 'nearly complete coverage', and publishes the complete count in its next U.S. International Trade in Goods and Services report. That full report also adds services, where the country sells more than it buys: in July, a services surplus of $31.0 billion left the deficit on goods and services together at $88.6 billion. Imports are valued at what was paid for the goods themselves: import duties, freight and insurance are left out. [1, 2]
Where the imports came from
The bureau sorts goods by what they are used for, in about 140 end-use categories that it adds up into six: foods, feeds and beverages; industrial supplies; capital goods; automotive vehicles and parts; consumer goods; and other goods. Industrial supplies are materials: the table notes that they include petroleum and petroleum products, and the full report's detail also lists natural gas, chemicals, copper, aluminum and nonmonetary gold, the gold that trades as a commodity. Capital goods are the equipment businesses buy, from generators and machine tools to civilian aircraft, computers, computer accessories and semiconductors, the chips. [1, 2]
In August, imports grew in five of the six. Industrial supplies were up 16.6 percent, to $62.4 billion, and capital goods 4.0 percent, to $145.8 billion, a level 57.2 percent above August 2025; by the desk's arithmetic on the table, the two added $8.9 billion and $5.6 billion, or $14.5 billion of the $17.4 billion increase. Other goods were up 18.8 percent, foods, feeds and beverages 5.5 percent and vehicles 0.9 percent. Consumer goods, at $57.0 billion, were the only category down, by 1.6 percent. [1, 3]
Exports increased 1.9 percent, their first rise from one month to the next since April, as Haver noted. Industrial supplies sold abroad were up 8.3 percent, other goods 7.3 percent and capital goods 2.0 percent, while consumer goods were down 10.5 percent, vehicles 6.9 percent and foods, feeds and beverages 5.6 percent. Against August 2025, exports were 14.5 percent higher and imports 27.9 percent. [1, 4]
Oil and AI equipment, as far as the record goes
Reuters put the import rise down to a 16.6 percent increase in industrial supplies, 'which include petroleum'. The advance report goes no further. It does not split the category, and its values are adjusted for the usual seasonal swings but not for price changes, so how much of August's $8.9 billion was oil, and how much was a higher price rather than a larger volume, is not known until the full report. For scale, July's full report put crude oil, the category's largest import, at $12.0 billion of $53.5 billion, with fuel oil at $1.8 billion and other petroleum products at $2.6 billion, and showed the country selling more petroleum abroad than it bought: $26.4 billion against $16.8 billion. [3, 1, 2]
Reuters tied the 4.0 percent rise in capital goods imports to 'an AI infrastructure buildout', meaning the computers and data centers being put up for artificial intelligence. The August detail is not out yet; July's full report shows what the category is carrying. That month imports of computers were up $6.9 billion, to $34.6 billion, computer accessories up $6.6 billion, to $26.8 billion, and semiconductors up $1.2 billion, to $13.0 billion; together they made up $74.4 billion of July's $140.3 billion, by the desk's arithmetic. In the first seven months of 2026 computer imports came to $220.8 billion, against $109.9 billion a year earlier. [3, 2]
What it does to growth
In the Bureau of Economic Analysis's arithmetic of gross domestic product, imports are subtracted. In its words: 'An increase in imports results in a negative contribution to GDP, and a decrease in imports results in a positive contribution to GDP.' Its third estimate for the second quarter, released the same morning, has GDP growing at an annual rate of 2.2 percent after price changes, 0.6 percent for the quarter itself; imports took 1.66 percentage points off that rate and exports added 0.56, so trade as a whole subtracted 1.10. In the bureau's tables trade also subtracted 0.25 of a point in the fourth quarter of 2025 and 0.04 in the first quarter of 2026: the three straight quarters Reuters counted. [5, 6, 3]
Growth is measured after price changes, and the advance figures are not: in July, the full report's price-adjusted figures put the rise in the goods deficit at 12.7 percent, against 17.7 percent in dollars. On the third quarter the reports agree. Reuters wrote that the figures suggest trade 'could remain a drag' on growth, and Haver that they point 'to a significant drag on GDP growth in Q3 2026'. After Wednesday's releases the Atlanta Fed's GDPNow model lowered its estimate of what net exports, exports less imports, contribute to third-quarter growth from minus 1.37 percentage points to minus 2.60, and its estimate of growth from 5.0 percent to 3.7, with consumer spending also marked down and private investment marked up. [1, 2, 3, 4, 7]
Reuters added that rising inventories, the goods businesses hold in stock, could blunt some of the hit. Inventories are their own line in the bureau's GDP tables, where they subtracted 0.53 of a point in the second quarter. The Census report shows wholesale inventories up 0.7 percent in August, to $965.7 billion, and retail inventories up 0.3 percent, to $881.6 billion, each with a margin of error of 0.2 of a point; against August 2025 they were 6.6 percent and 4.8 percent higher. [3, 6, 1]
What settles it next
The full August report, U.S. International Trade in Goods and Services, on Tuesday 6 October: the complete count, services, the split of industrial supplies into crude oil, fuels, metals and gold, the computers and semiconductors inside capital goods, and the price-adjusted figures. Revised wholesale estimates on Monday 26 October, folded into the September advance report on Wednesday 28 October. Then the Bureau of Economic Analysis's first estimate of third-quarter GDP, at 8:30 a.m. on Thursday 29 October, the first official figure for what trade did to the quarter. [2, 1, 5]
Who it reaches
The capital-goods line runs through the makers of AI hardware, none of them named in a report that counts goods, not companies. NVIDIA's annual report says its supply chain is concentrated in Asia and names Hon Hai, Wistron and Fabrinet among the contract manufacturers, companies paid to build other firms' products, that assemble, test and package its final products. Super Micro Computer's annual report says its servers are assembled and tested in San Jose, Taiwan, the Netherlands and Malaysia, and that after a Supreme Court ruling in February 2026 it may be entitled to a refund of tariffs it paid on imported products. Dell Technologies sells AI-optimized servers and says significant portions of its products are assembled by contract manufacturers, primarily in Asia. [1, 8, 9, 10]
Sources
- U.S. Census Bureau, Monthly Advance Economic Indicators Report, August 2026 (CB26-159: goods trade by end-use category, wholesale and retail inventories), 2026-09-30
- Census Bureau and BEA, U.S. International Trade in Goods and Services, July 2026 (the full report: monthly series, commodity and petroleum detail, next release), 2026-09-03
- Reuters via Yahoo Finance, US goods trade deficit widens sharply in August, 2026-09-30
- Haver Analytics, U.S. Goods Trade Deficit Balloons Further in August, by Winnie Tapasanun, 2026-09-30
- Bureau of Economic Analysis, GDP (Third Estimate), 2nd Quarter 2026, with the annual update (release, BEA 26-42), 2026-09-30
- Bureau of Economic Analysis, national accounts quarterly data file: Table 1.1.2, contributions to percent change in real GDP (as updated 30 September 2026), 2026-09-30
- Federal Reserve Bank of Atlanta, GDPNow commentaries (the update of 30 September 2026), 2026-09-30
- NVIDIA, annual report on Form 10-K for the fiscal year ended 25 January 2026 (manufacturing and supply chain), 2026-02-25
- Super Micro Computer, annual report on Form 10-K for the fiscal year ended 30 June 2026 (manufacturing facilities, tariffs), 2026-08-31
- Dell Technologies, annual report on Form 10-K for the fiscal year ended 30 January 2026 (manufacturing, AI-optimized servers), 2026-03-16
Every stock is a company; the desk grades the company behind the stock. This article describes; it does not recommend. Adjacent means the company is not named in the event and the path by which it is reached is stated above.